Regular monitoring checks a site from one point. But a site can work in Germany and not open in Kazakhstan because of providers and local networks. MultigeoMonitoring checks domains from selected countries and sends an alert when something goes down somewhere. The spec came as a wish list; I rewrote it into a BRD and then did the structure, interface and landing page.
All projectsMultigeo
SaaSObservabilityGeo monitoringVuePrimeVue
MultigeoMonitoring
A service that checks website availability from dozens of countries. I led the product from breaking down the spec to the interface. It now runs as checkme.dev.
Context
Monitoring that looks from different countries
LogicProblems first
Data axisCountry
StatusLive, checkme.dev
ScopeThe whole product
Task
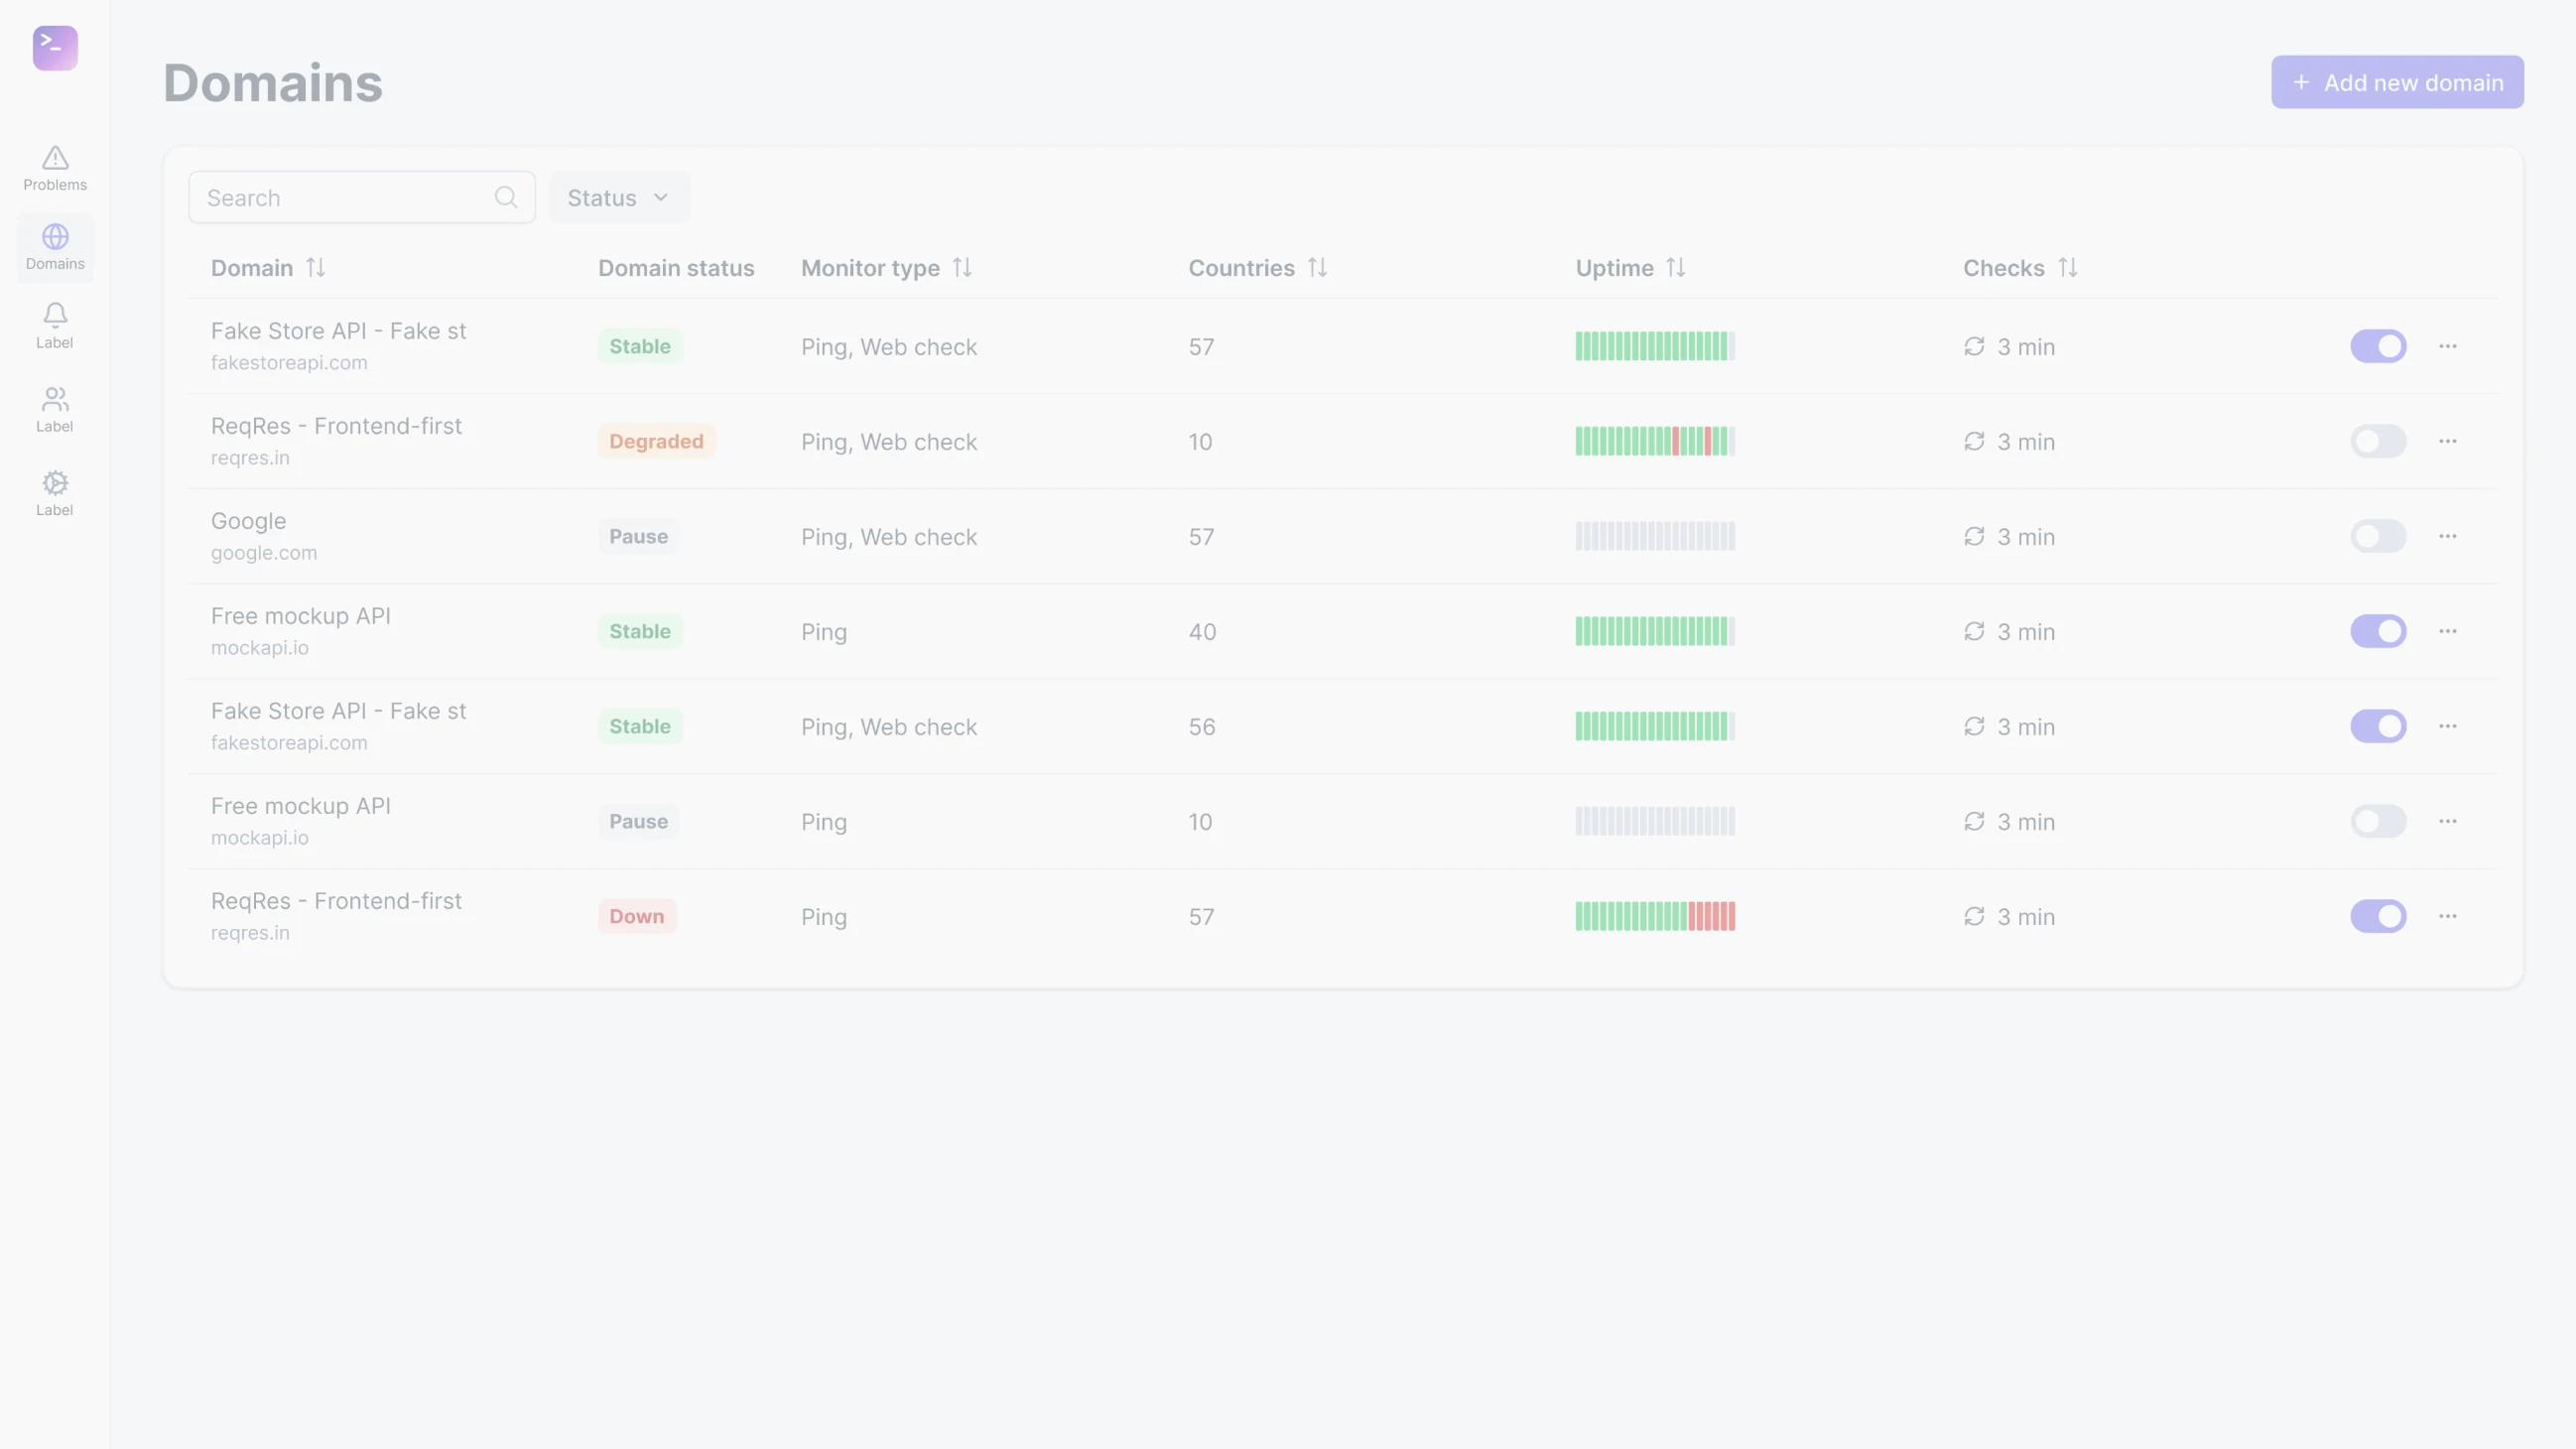
The “domains × countries” matrix
Dozens of countries times hundreds of domains. Show it all at once and you get a heat map where nothing is visible, and at a thousand domains it simply falls apart. It had to be clear within a second where things are bad.
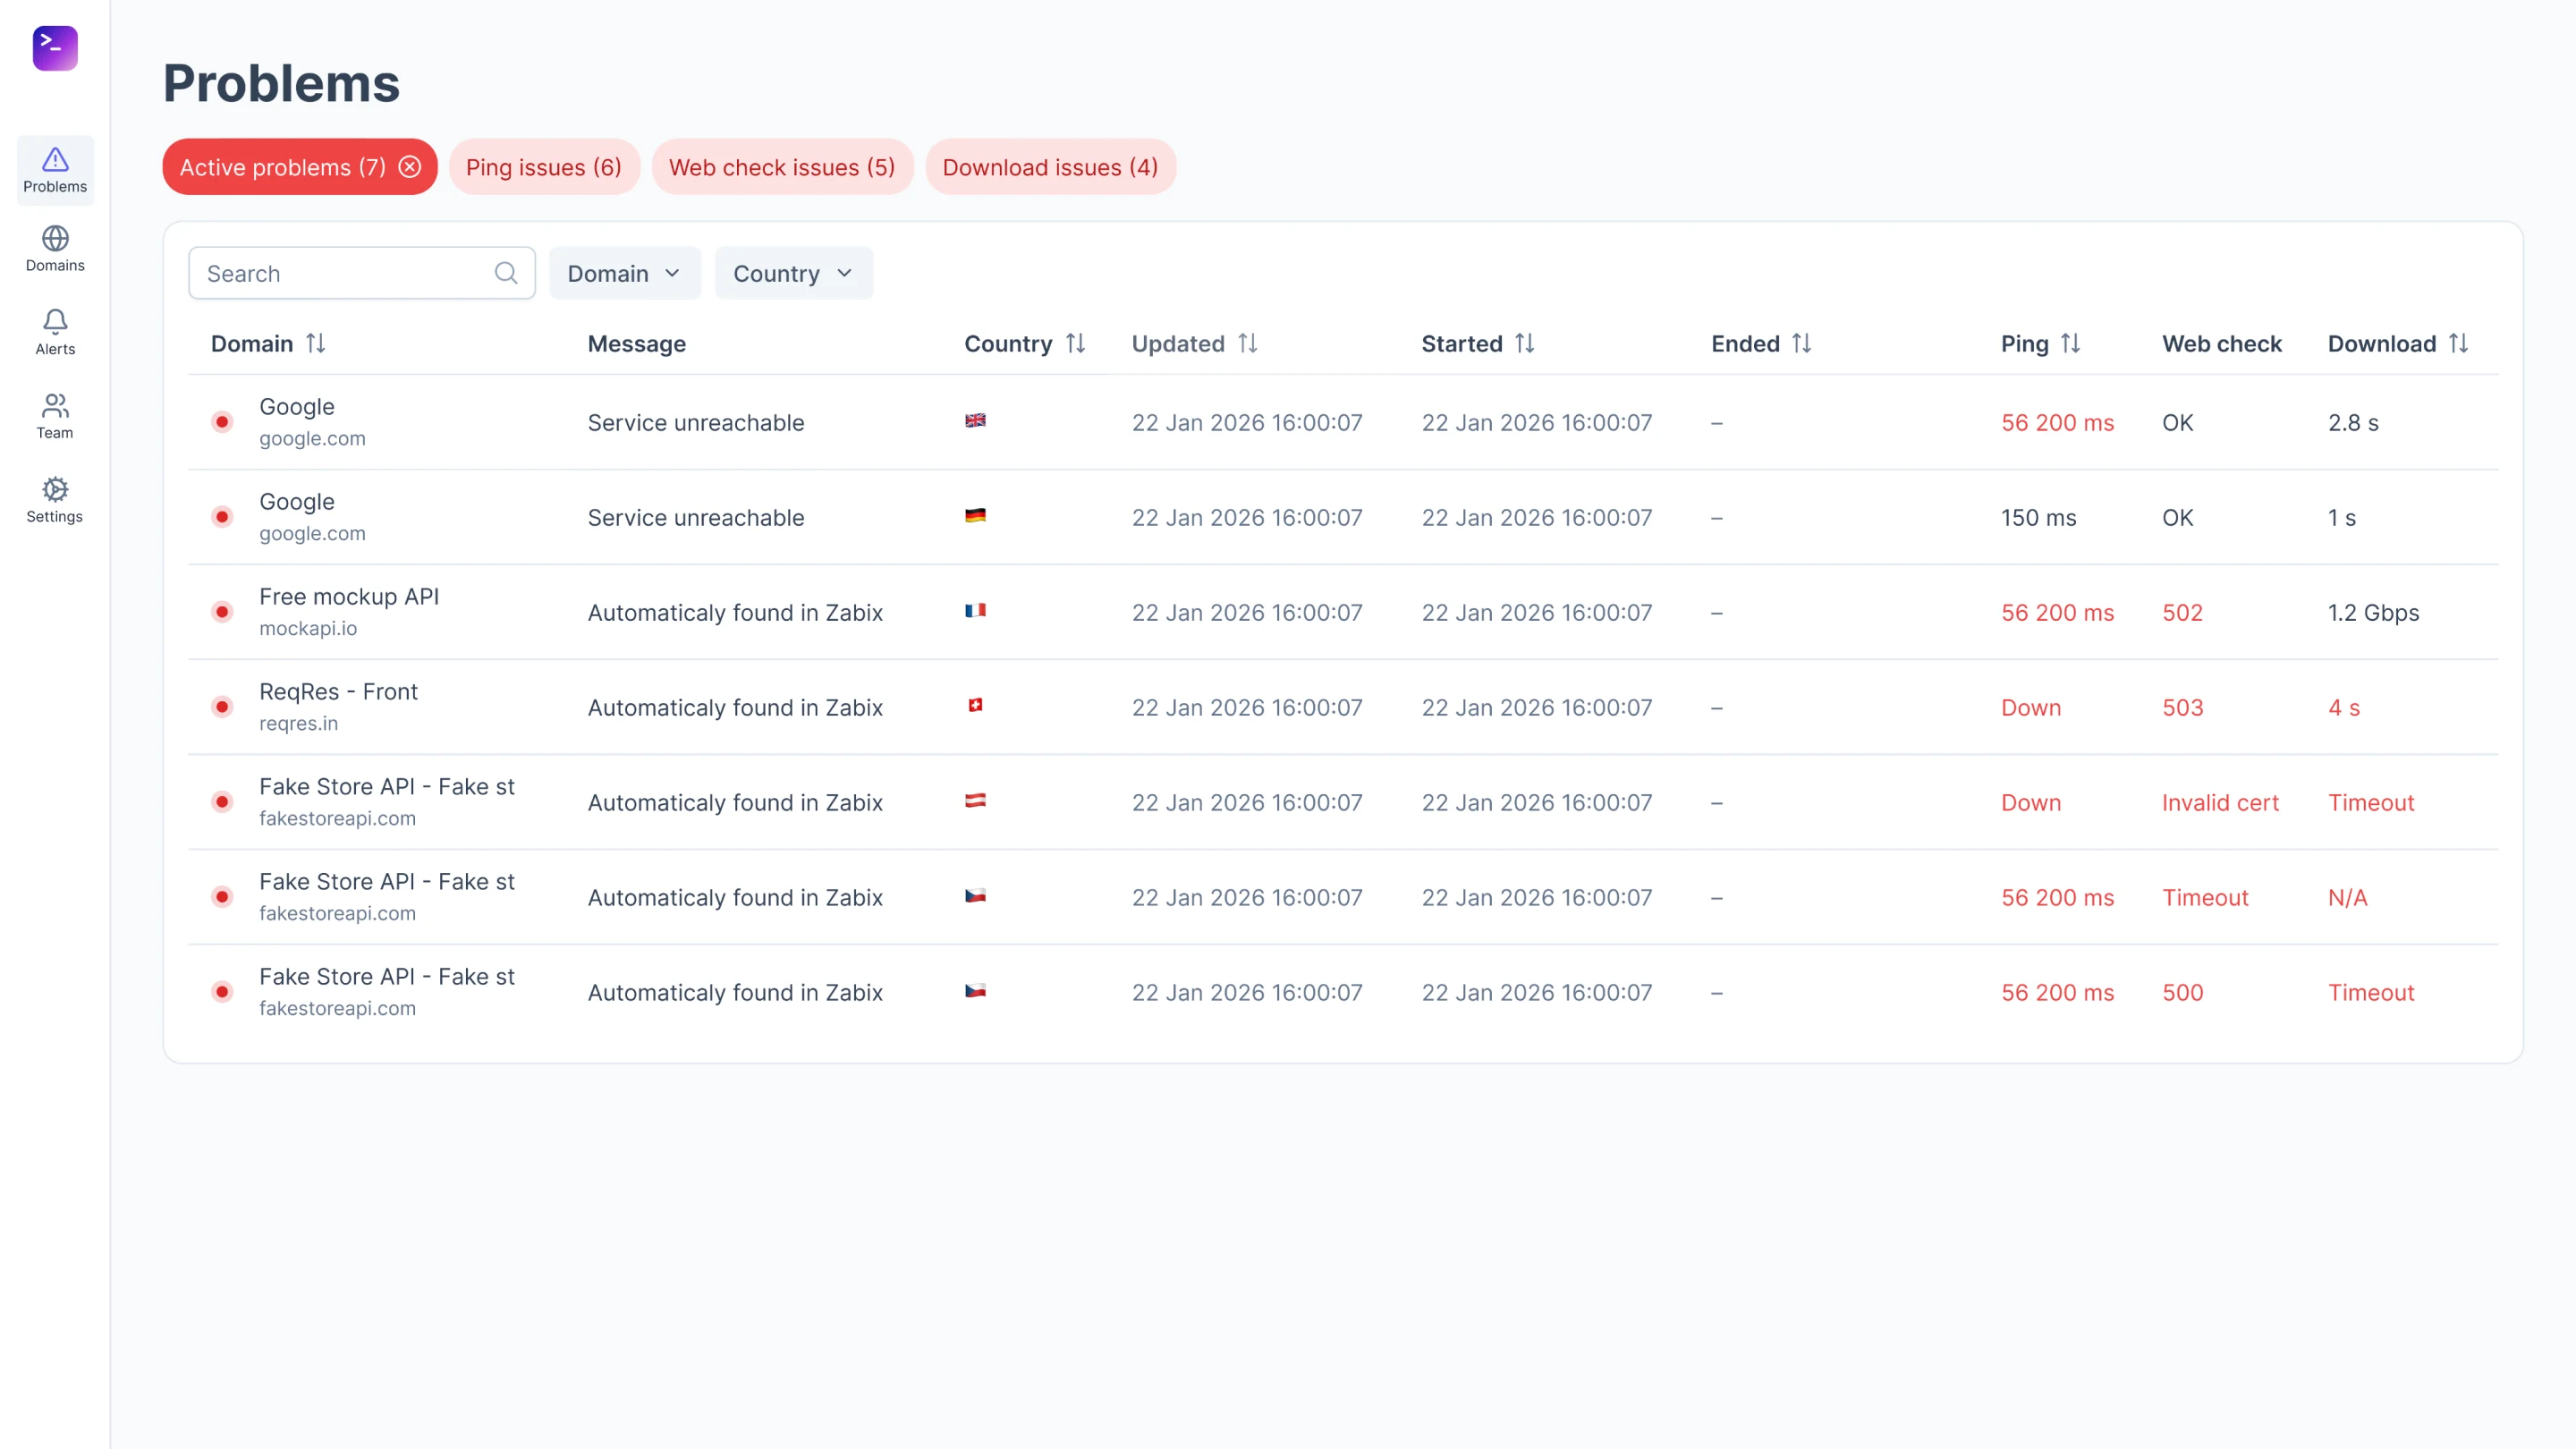
The product opens on problems
Usually the main monitoring screen is a green “all good” dashboard, with errors on a separate tab. I did the opposite: by default you only see what’s down, in which countries and with what error. The on-call engineer doesn’t have to search for anything and immediately sees what to react to.
Country at the core of the model
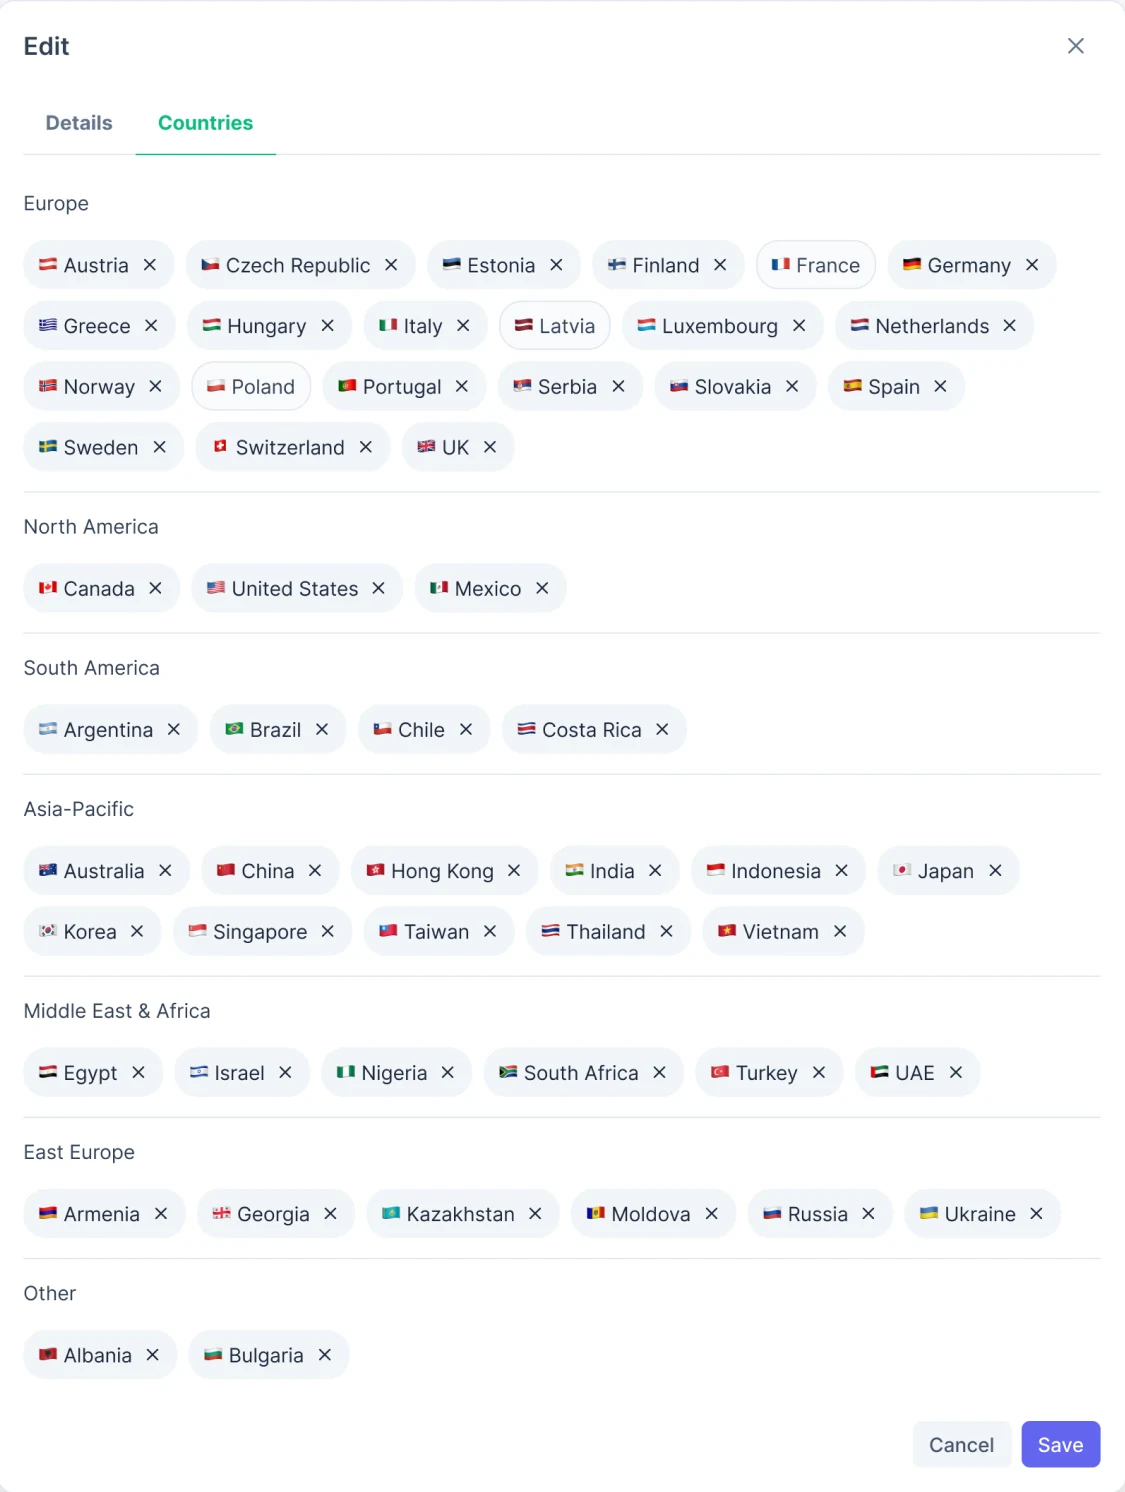
Competitors hide country selection in advanced settings. Here the country is at the core of the data: each has its own ISO code, flag, time zone and date format. Countries for a domain are picked by region in one window.
Three levels instead of one huge table
I split the heat map into three levels. At the top, only countries with problems. Expand a country and you see the domains that are down. Expand a domain and you see the specific check. That way the screen doesn’t fall apart even at a thousand domains.
Level 1CountriesOnly countries where something is down.
Level 2Domains in a countryDomains that are down in that country.
Level 3Check detailsWhat went down, when and how.
Principle
The first thing a person sees is what’s broken. Reports and charts come as a second layer.
Positioning
How it differs from UptimeRobot, StatusCake and BetterStack
Problems firstOpens on domains that are down, reports as a second layer.
Country at the coreFor competitors geo is an extra setting, here it’s the core of the data.
Doesn’t break at scaleThree levels of detail instead of one table.
SaaS from day oneBilling, roles, teams and API keys are built into the MVP.
Outcome
The product launched as checkme.dev
The service is live at checkme.dev. I also designed the landing page, in several versions, but it wasn’t picked up: there were no resources, and the frontend developer built the site himself.
What I’d do differently
I’d test the level-by-level drill-down with real on-call engineers. And I’d put the status colors into tokens with a contrast check right away.