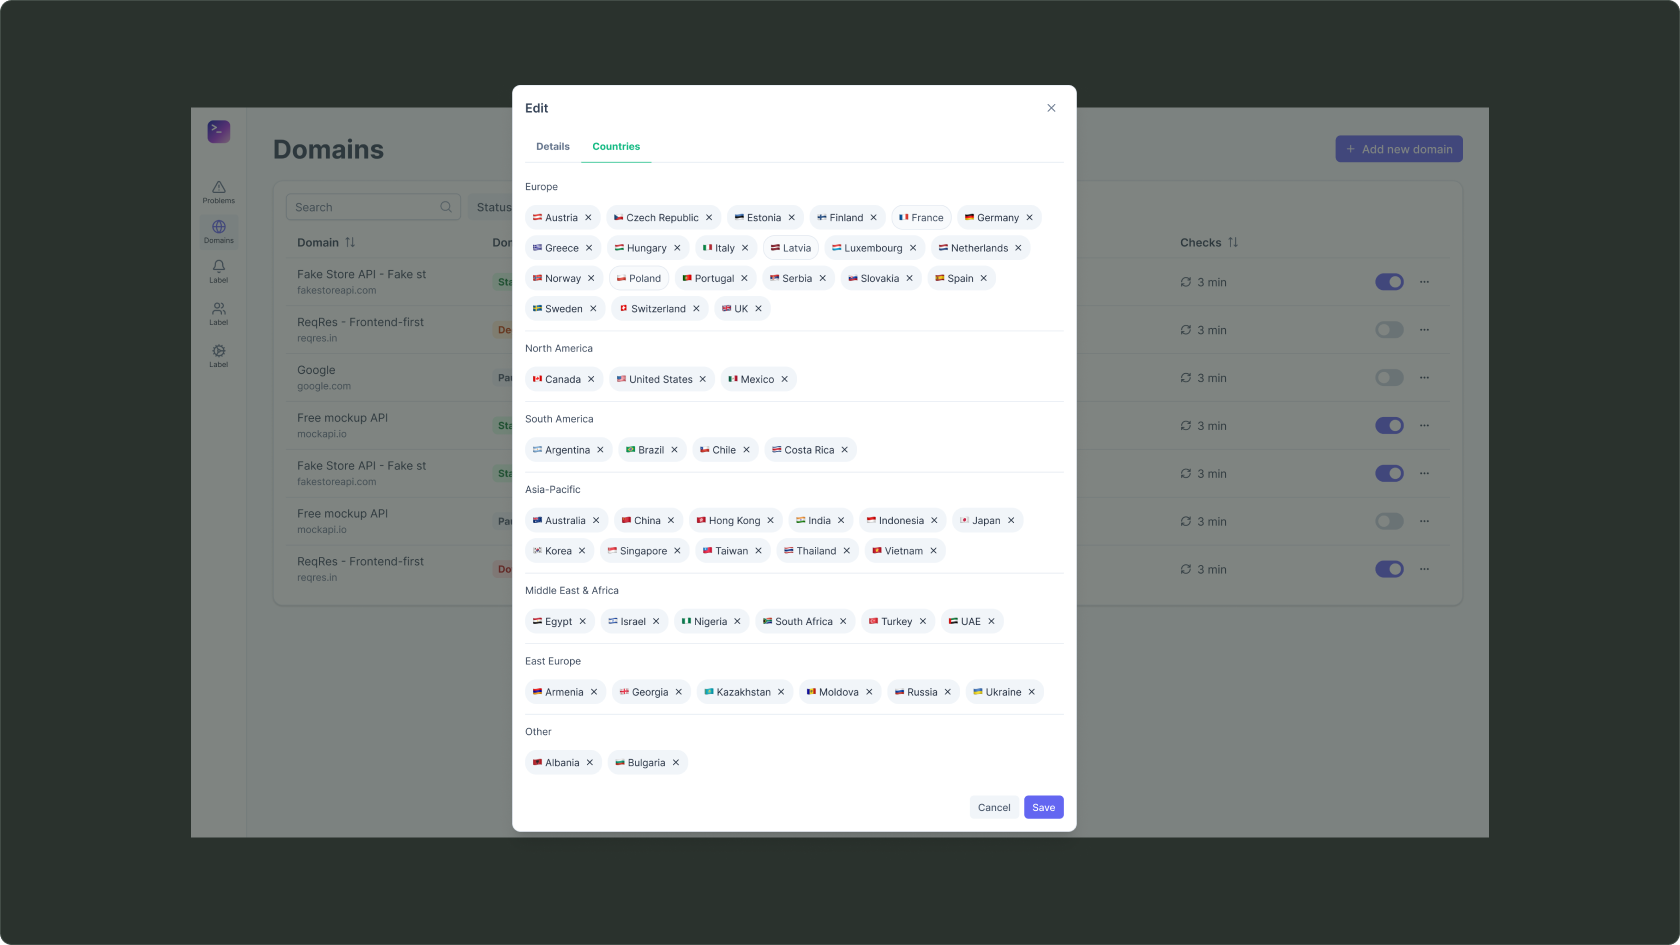
Countries
Only countries with incidents — errors-only by default.
Pick whatever works — I usually reply within a day.
Telegram@ipapermoon Emailohimsotiredtoday@gmail.com Full résumé on hh.ru ↗A SaaS service that monitors availability from dozens of countries. Incident-first: it shows not “all good”, but exactly where the service is down.
Context
MultigeoMonitoring checks domain availability from many selected countries in real time and sends alerts on outages. Ordinary uptime monitoring looks from a single point — but real availability depends on geography, ISP routing and local networks. I owned product design: from analytics and the BRD to architecture, the landing page and UI patterns.
Goal
Geo-monitoring produces a dense matrix: dozens of countries against hundreds and thousands of domains. Done naively it turns into an unreadable heatmap that breaks at scale. I had to build an interface where you see “where it’s bad” in a second, and which doesn’t fall apart at 1000 domains.
What I did
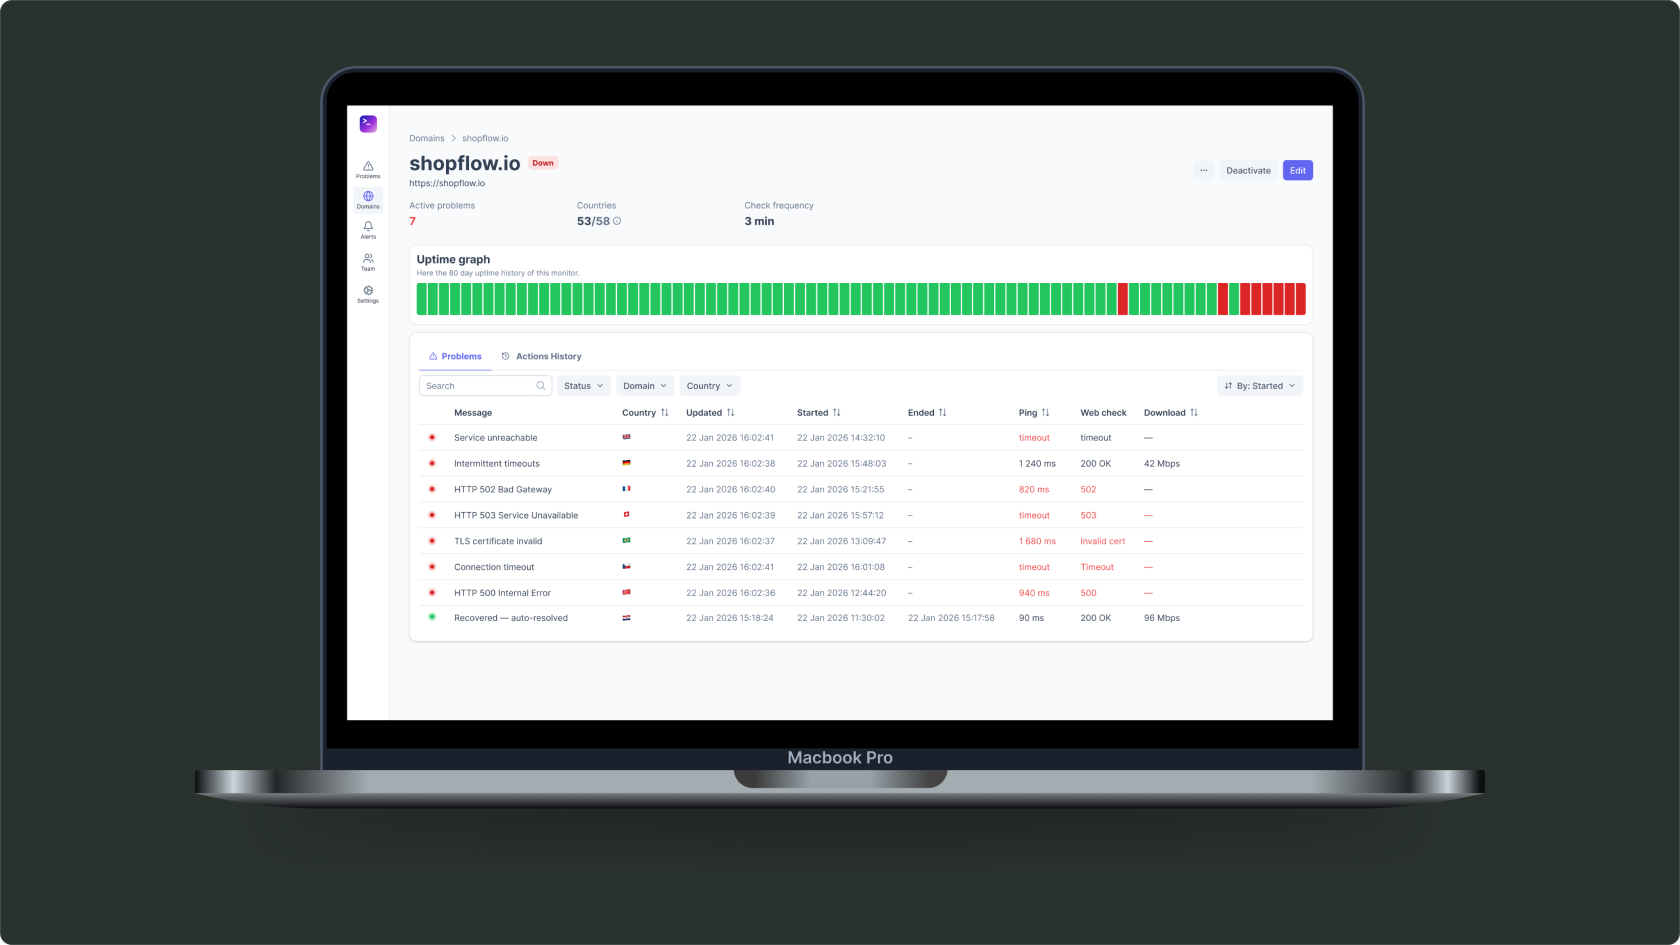
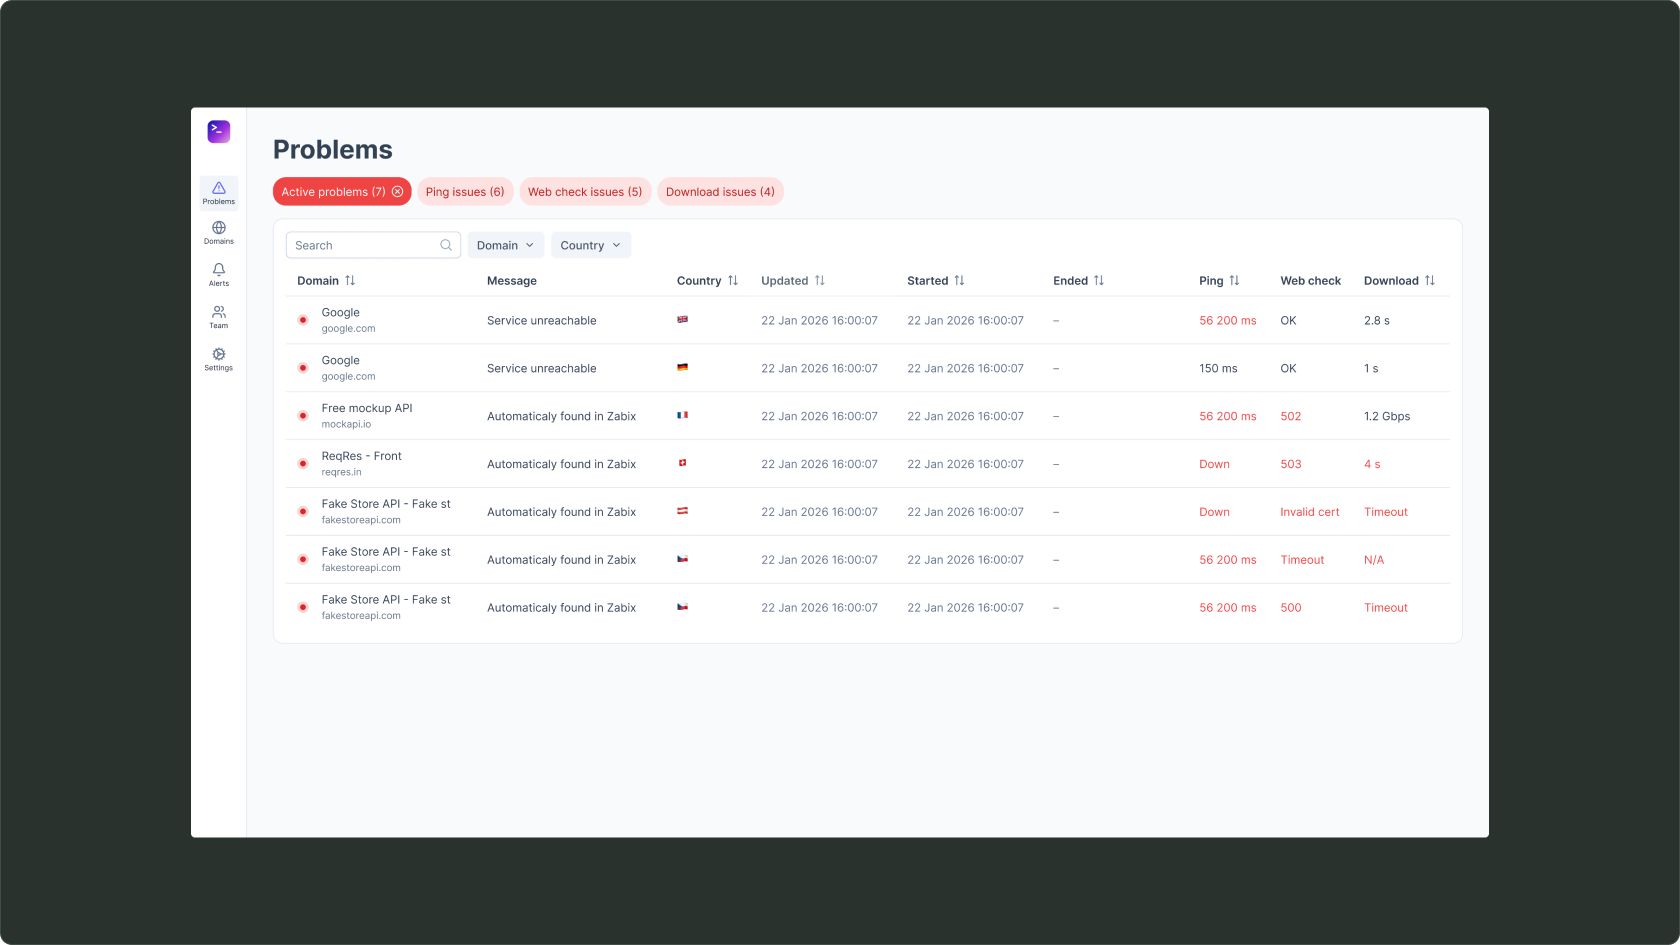
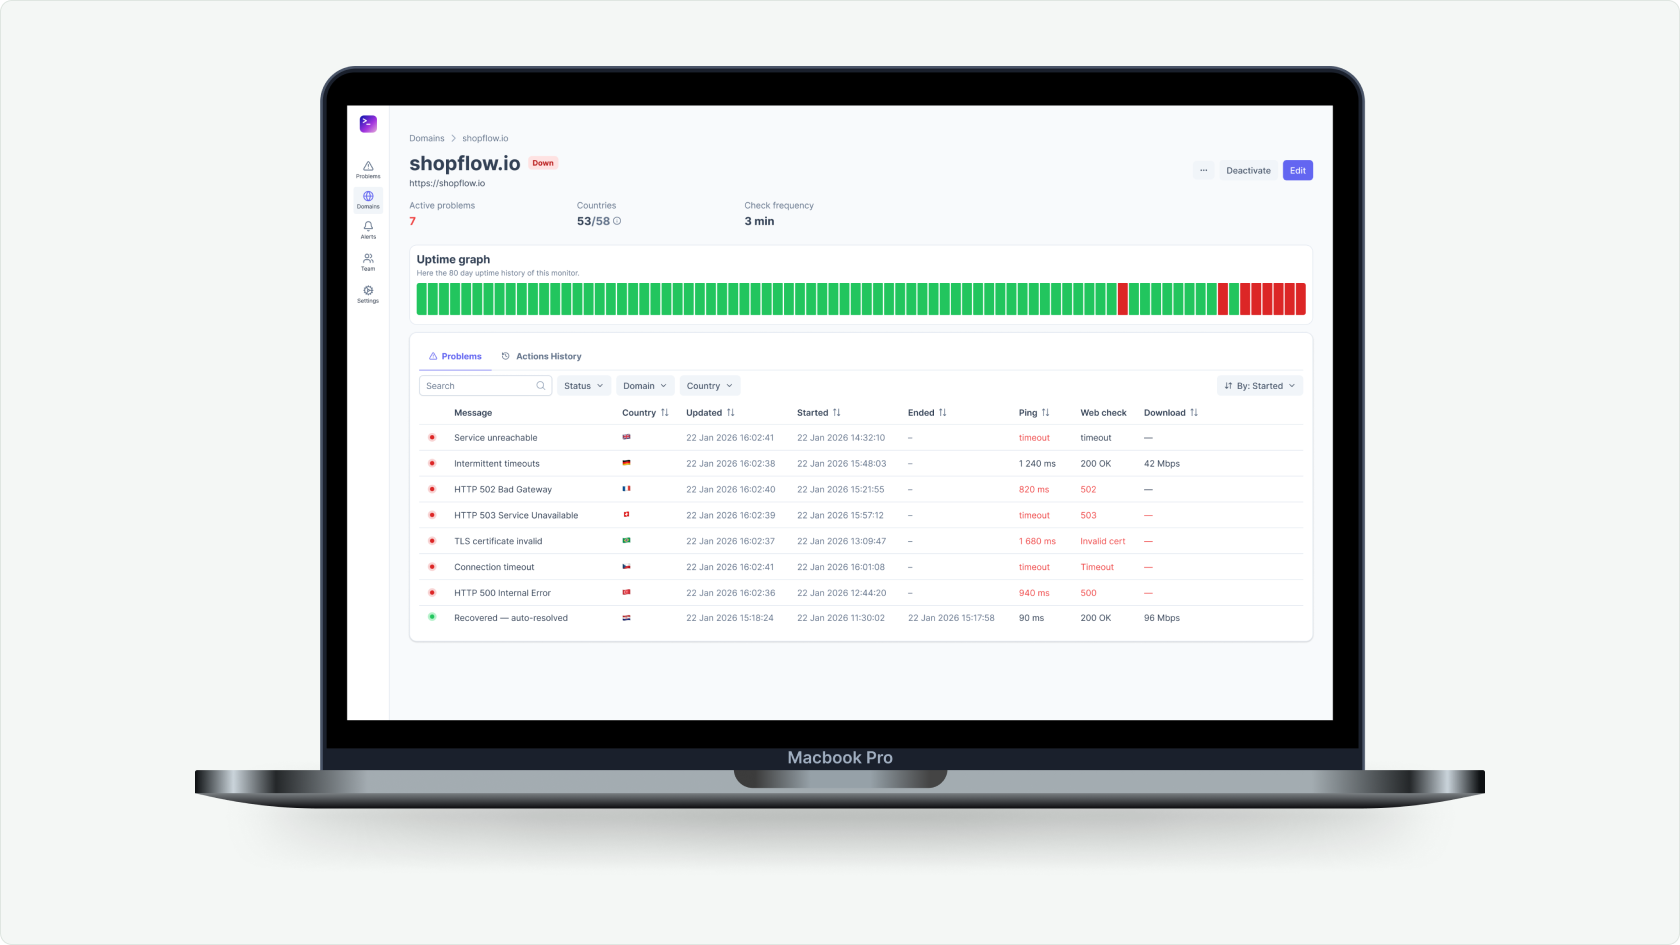
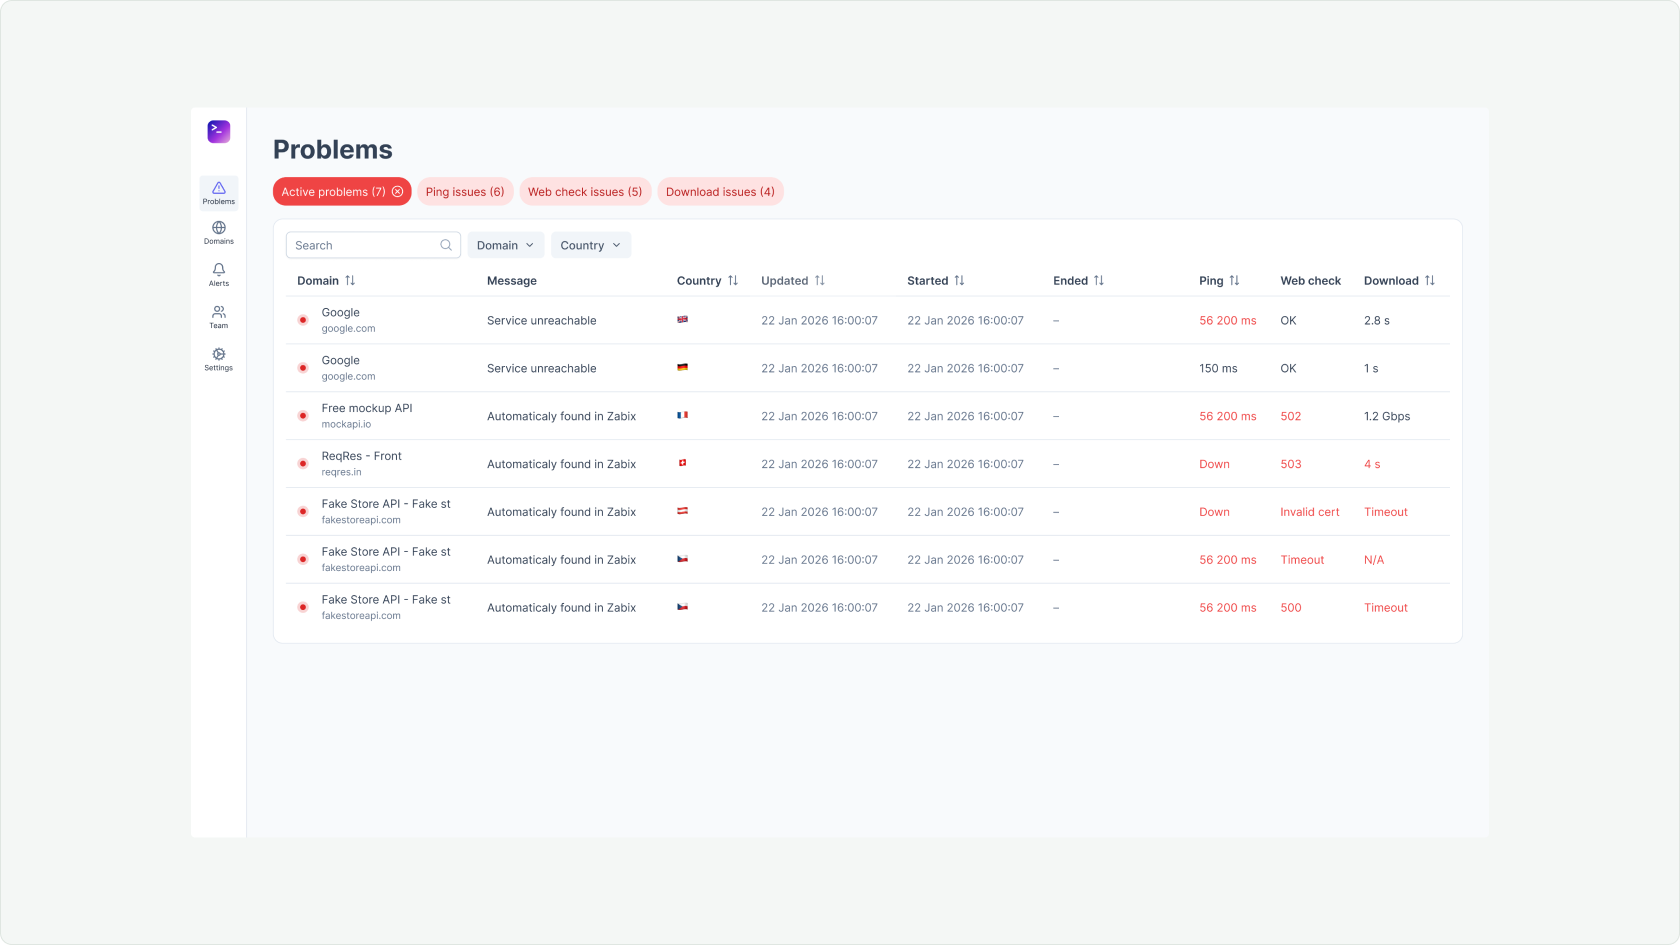
I made errors-only the primary mode, not a secondary tab. The product opens on problems: you immediately see which domains are down and in which countries — an interface for responding, not for reports.
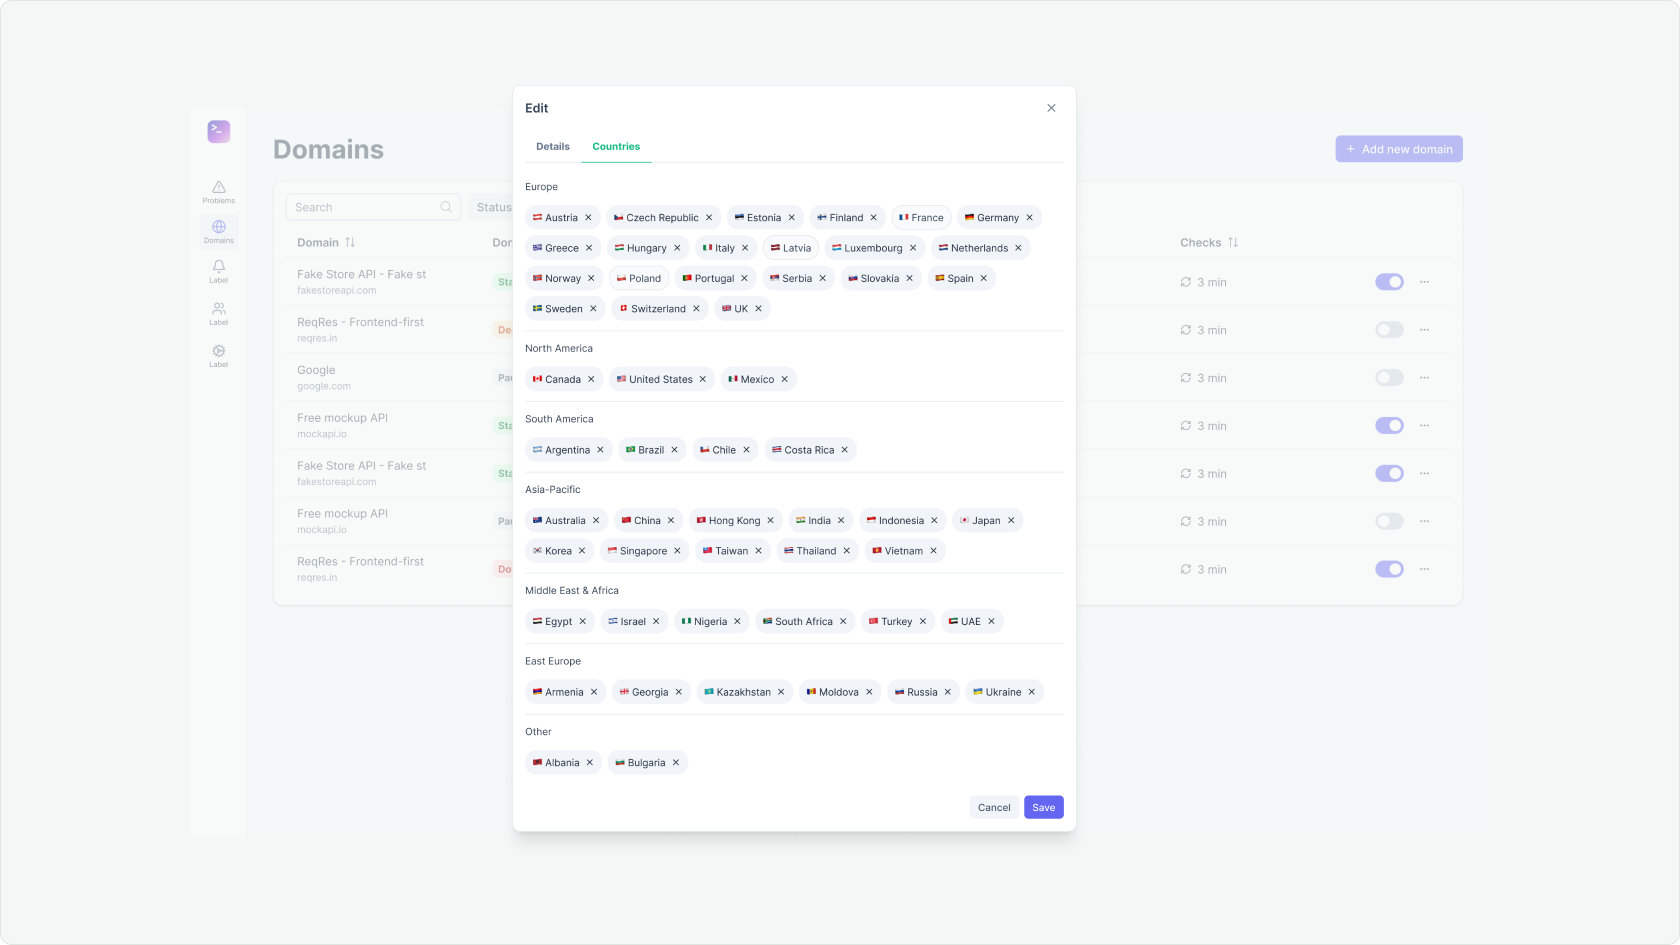
I rebuilt the data around country as the primary axis: country tokens, ISO codes, flag emojis, careful time zones and date formats. For competitors geo is an extra setting; here it’s the core of the model.
I collapsed the unreadable “domains × countries” heatmap into a three-level system with disclosure on demand: at the top, only countries with problems; deeper, the domains inside a country; deeper still, the details of a specific check. So the interface doesn’t fall apart at scale.
Principle
An interface should show not “all good” but “exactly where it’s bad”. Errors-only is the primary mode, not a secondary tab.
Positioning
Outcome
Out of a dense matrix and “VPN chaos” came a readable incident-first product: a geo-centric model, progressive disclosure, built-in SaaS readiness and a dark landing page matching the positioning.
What I’d do differently
The three-level disclosure was worth testing on real operator shifts, and the incident colour semantics worth taking to strict tokens with a contrast check.
Next
Next project